
Eyan Documet
Eyan Documet
Mechanical Engineer obsessed with solving high-stakes, highly-technical problems.
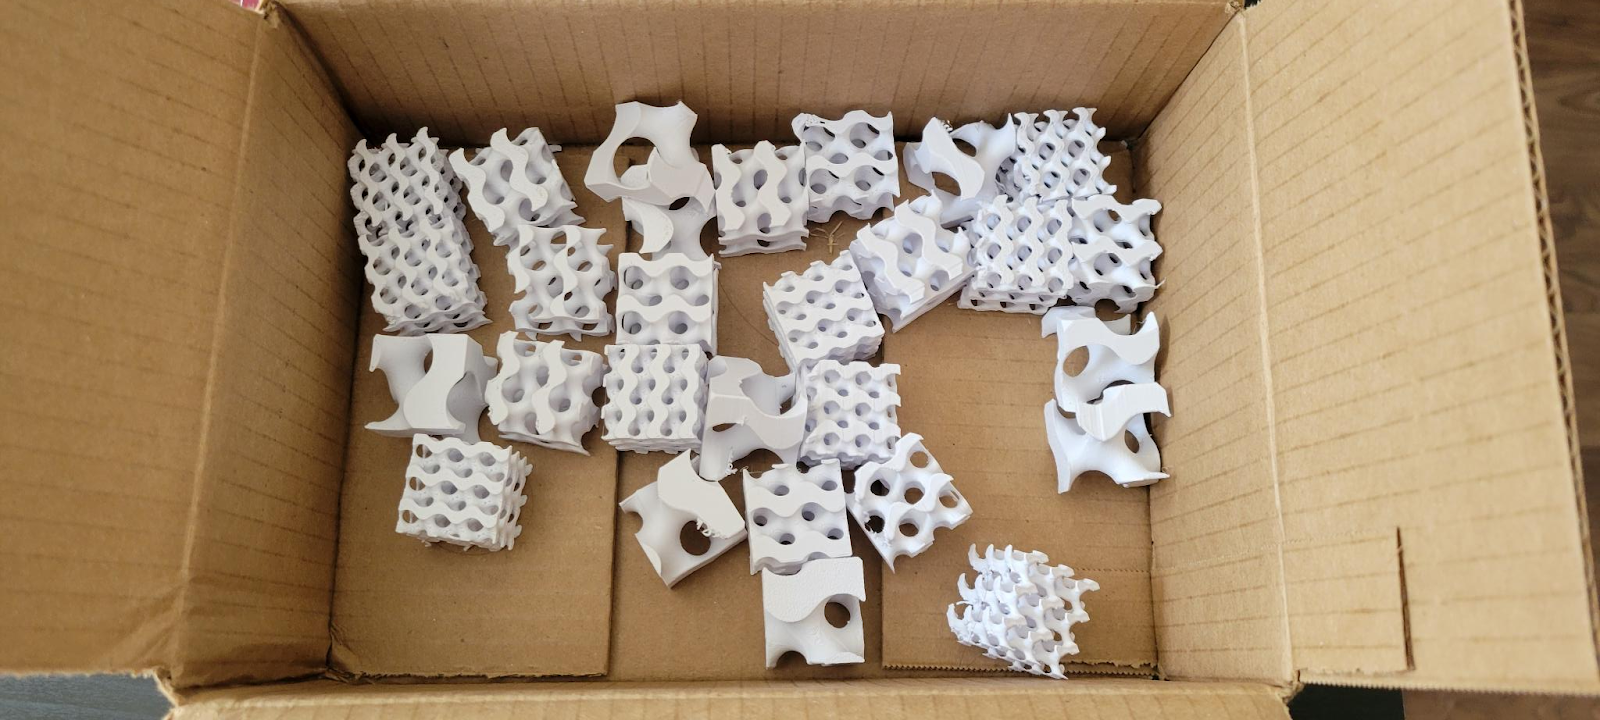
Gyroid Measurement Experiment
This project explores the optimization of 3D-printed gyroids for enhanced energy absorption. By crushing lattice structures across a varied design space, we identified the non-linear “sweet spot” for mechanical performance.
I owned the experimental design, MATLAB automation, and statistical modeling for the project.
Note: This page is a summary. For full documentation, see Comprehensive Final Report (PDF) and Summary Slides (Google Slides) explaining the results of our work.
Skills Demonstrated
- Experimental Design & Instrumentation. Calibrated and executed Instron compression tests, ensuring accurate force and displacement measurements.
- Data Analysis & Statistical Modeling. Processed load-displacement data, computed mechanical energy absorption, and applied regression modeling and hypothesis testing to confirm findings.
- Scientific Communication. Designed useful and compelling figures that communicate data insights and highlight key trends. Technical writing is also included in the presentation.
Experimental Design & Test Matrix
We mapped a 2D design space by varying isovalue (t) and unit-cell density. This 3×3 factorial design ensured we captured the full spectrum of the lattice’s mechanical response.
| Runs | Isovalue (t) | Unit Cell Density |
|---|---|---|
| 1–9 | 0.25 | 1, 2, 3 Units |
| 10–18 | 0.50 | 1, 2, 3 Units |
| 19–27 | 0.75 | 1, 2, 3 Units |
Note: Each configuration was tested in triplicate (n=3) to ensure statistical significance and minimize noise from FDM print variances.
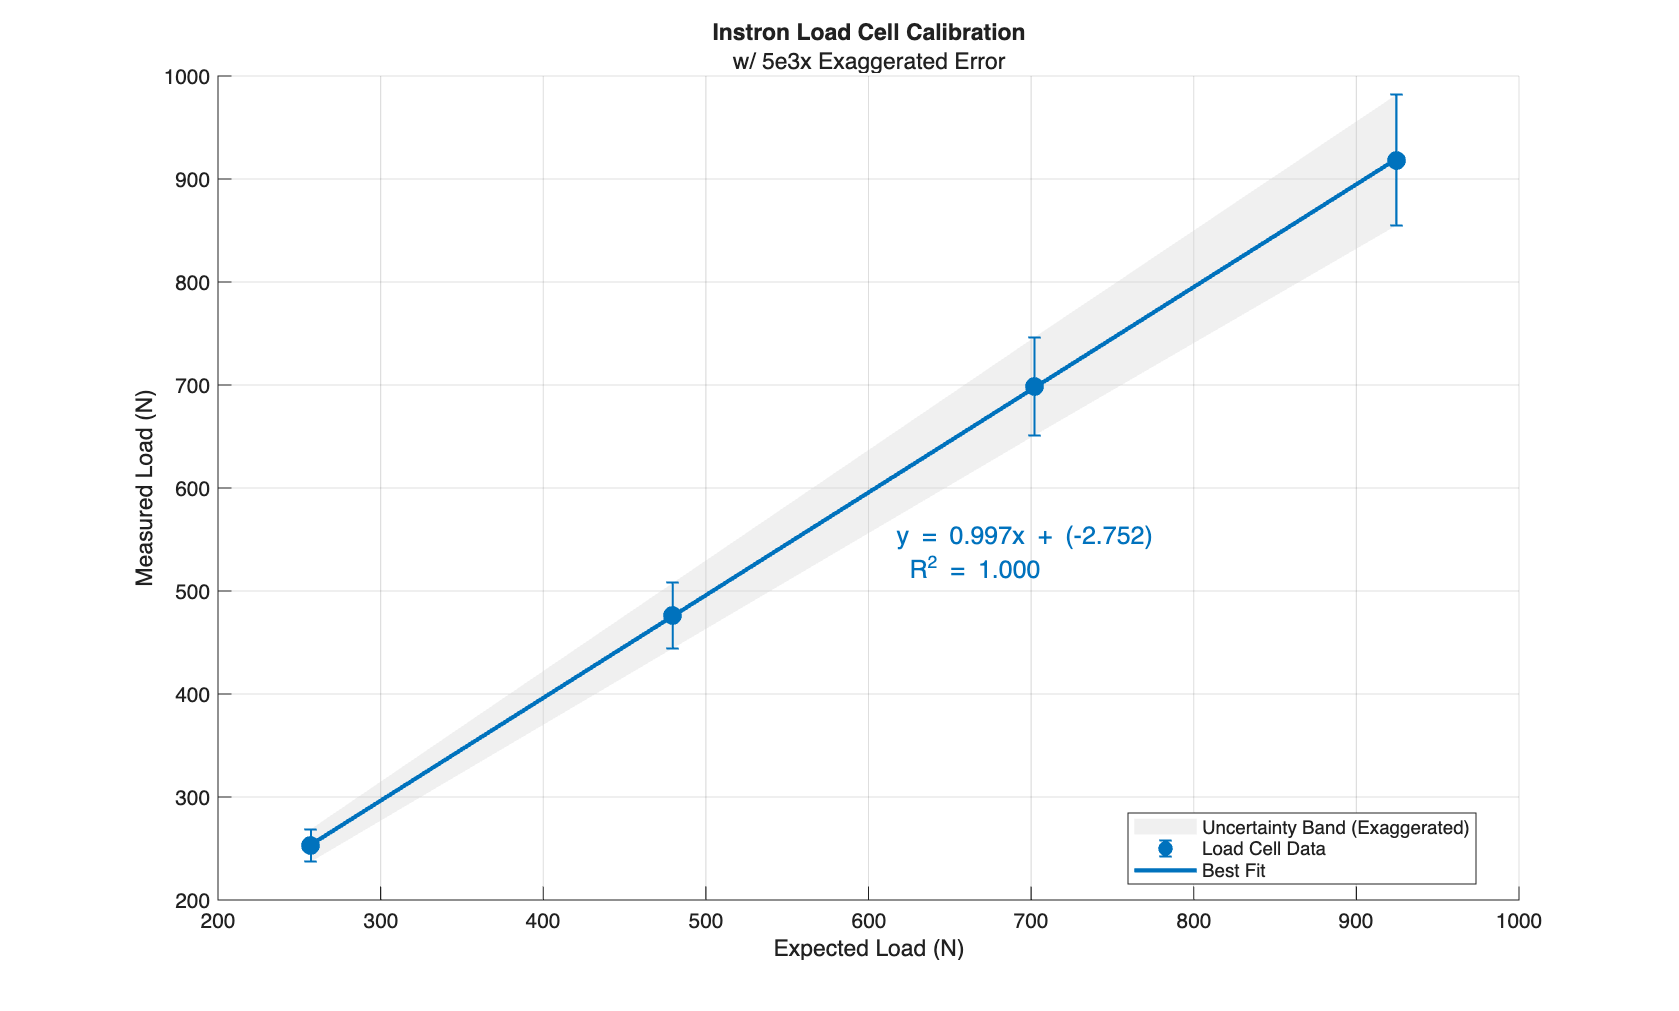
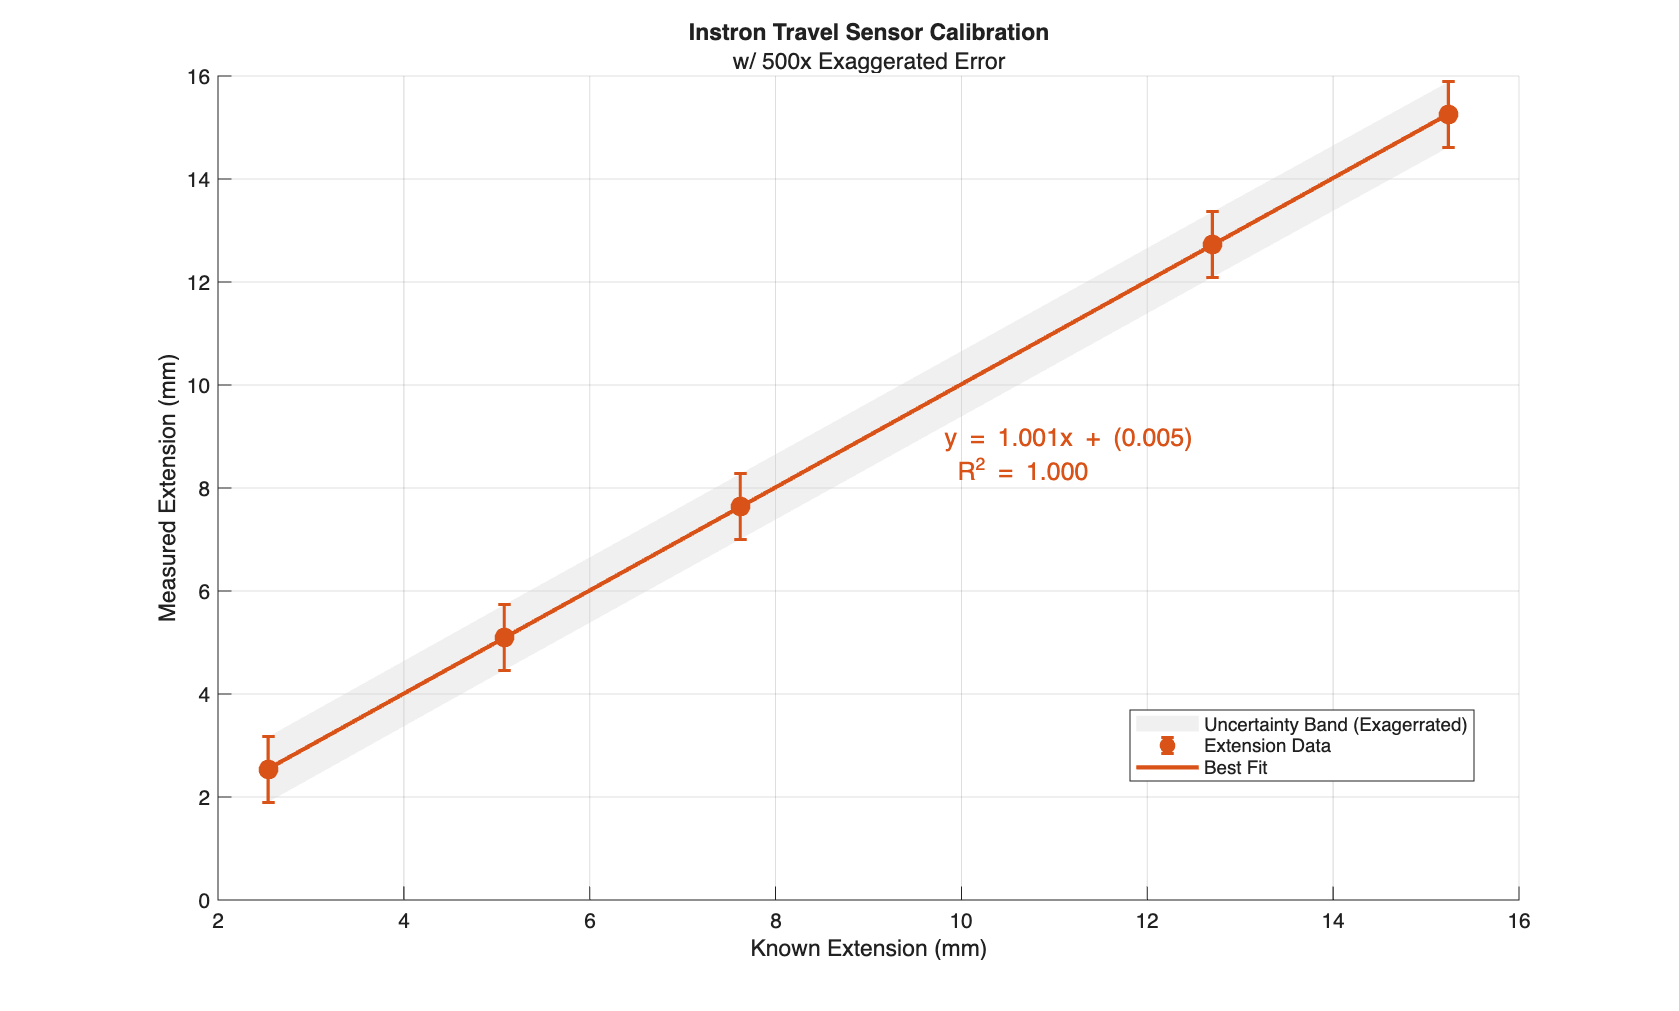
DAQ, Calibration, and Regression
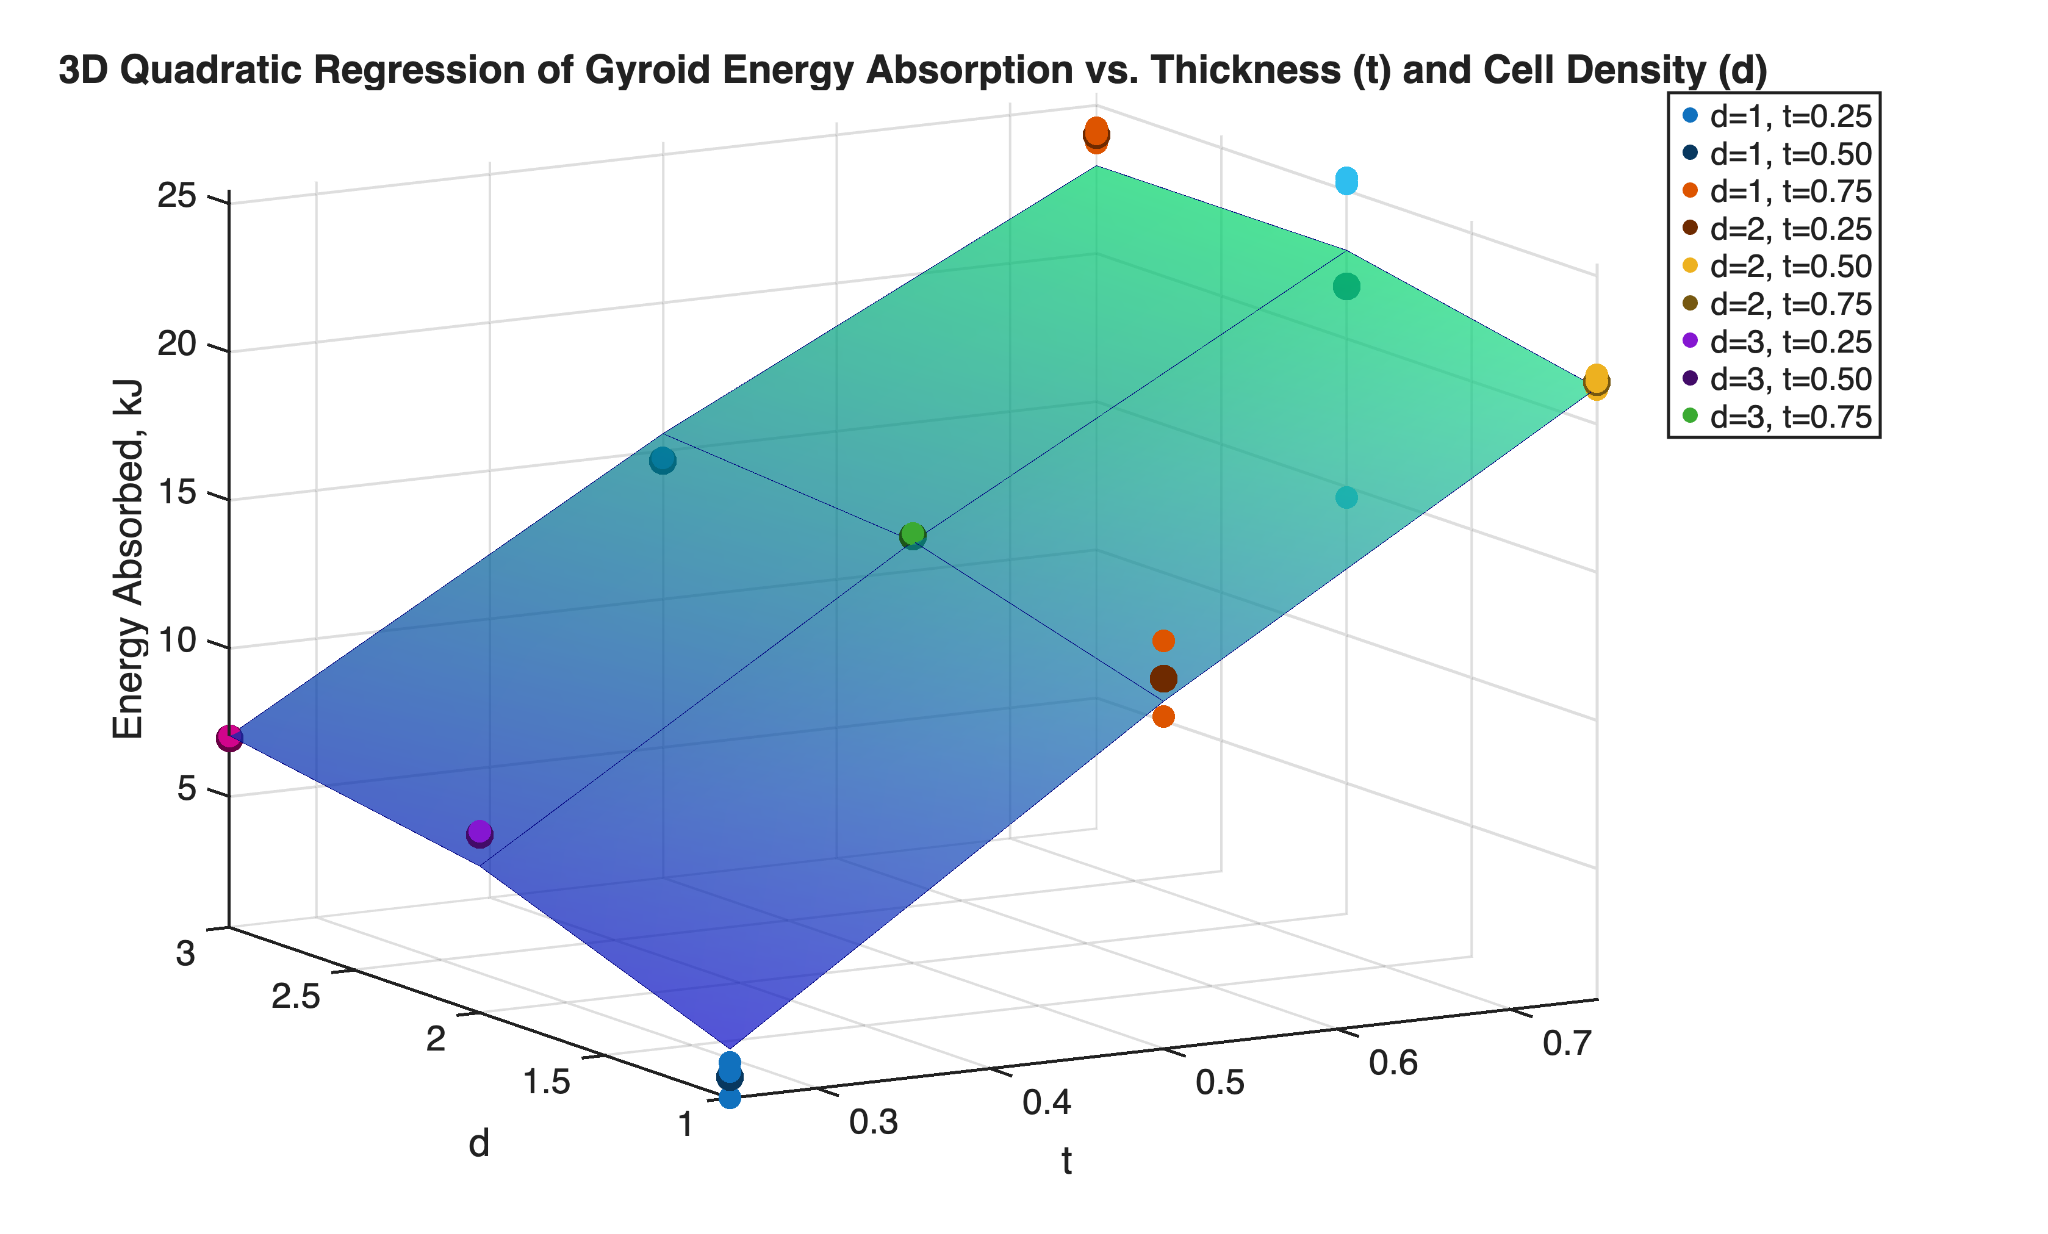
Energy absorption (W) was calculated as the area under the force-displacement curve. Samples were compressed using an Instron Universal Testing Machine. The resulting data was processed through a quadratic regression model to visualize the performance “topography” of the gyroids.
Calibration Results
Result Topography
Mechanical Observations & Variability
While the quadratic model provided a high global fit (R² = 0.94), local deviations were observed in low-isovalue samples.
- Manufacturing-Induced Anisotropy. At lower isovalues, the FDM layer-height became significant relative to the strut’s cross-sectional area. This increased the “grain” effect of the print.
- Failure Mode Shift. While high-density samples failed through predictable plastic deformation, low-isovalue samples transitioned to brittle delamination. This suggests that as the feature size approaches the manufacturing resolution, the material’s inter-laminar bond strength becomes the dominant failure bottleneck rather than the lattice geometry itself.